#
ODAM for Setting Up a Successful Analytics Center of Excellence
Part III
Key High-Level Activities
When it comes to using ODAM to set up your analytics center of excellence (ACE), there are key activities that are critical to the organization’s overall success. These include program management, platform management, getting data in, creating analytics, receiving feedback, education and training, the identification of IT services, and IT service visualization.
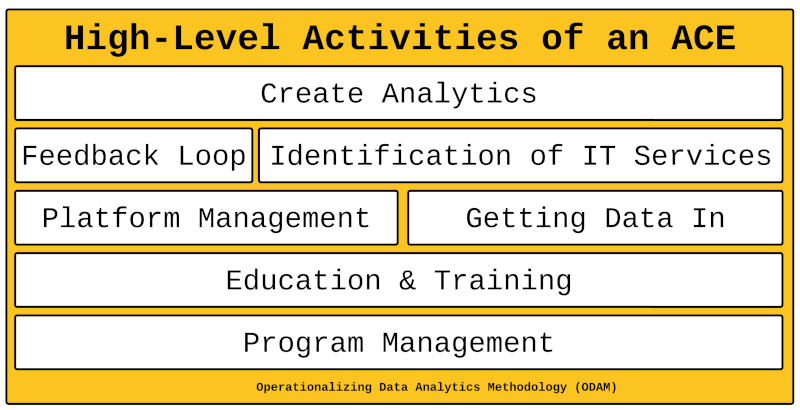
- Program management involves overseeing and coordinating the various activities and initiatives that are part of the ACE. This includes setting goals and objectives, establishing policies and procedures, and ensuring that the ACE is aligned with the overall goals and objectives of the organization.
- Education and training are important components of the ACE, as they ensure that team members have the necessary skills and knowledge to effectively use and contribute to the ACE. This may include training on specific technologies or processes, or providing guidance and support to help team members become proficient in using the ACE.
- Platform management involves the deployment and maintenance of the technical infrastructure and tools that are needed to support the ACE. This may include data storage, data processing, data visualization, and other technical components.
- Getting data in involves the process of acquiring and preparing data for analysis. This may include extracting data from various sources, cleansing the data to ensure its quality and integrity, and transforming the data into a usable format.
- Creating analytics involves the development of algorithms and models that can be used to analyze and interpret the data. This may include statistical analysis, machine learning, or other techniques.
- The identification of IT services involves the process of mapping out the various IT services that are used by the organization and how they are related to one another. This helps to provide context and understanding of the data and analytics being generated by the ACE.
- Receiving feedback involves gathering and incorporating feedback from users and stakeholders on the performance and effectiveness of the ACE. This may include gathering feedback on the usefulness of the analytics, the accuracy of the results, and the user experience.
#
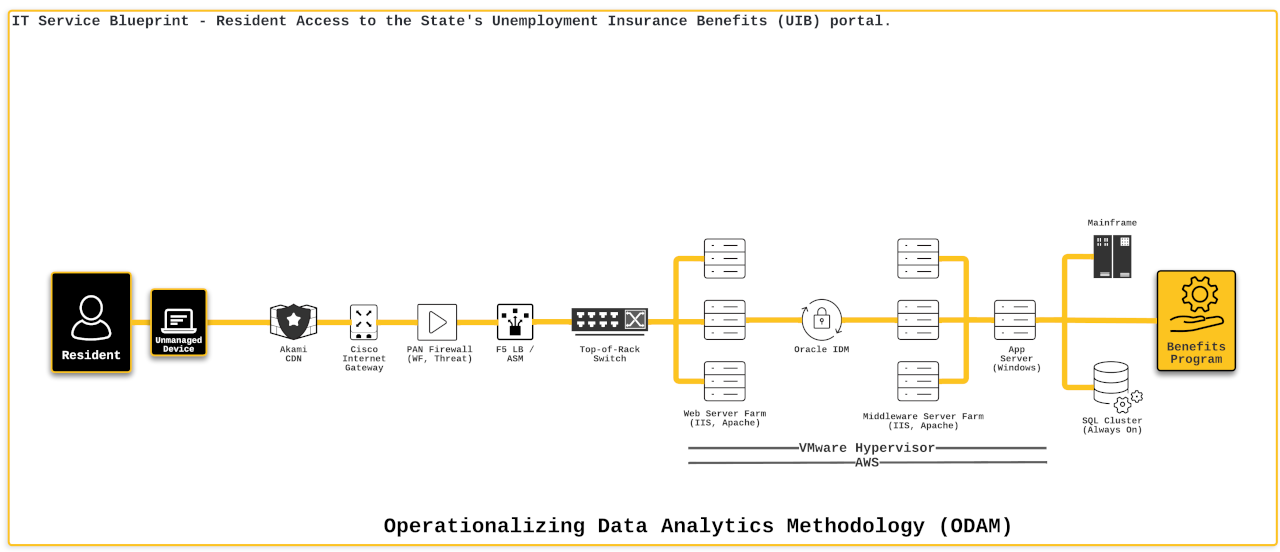
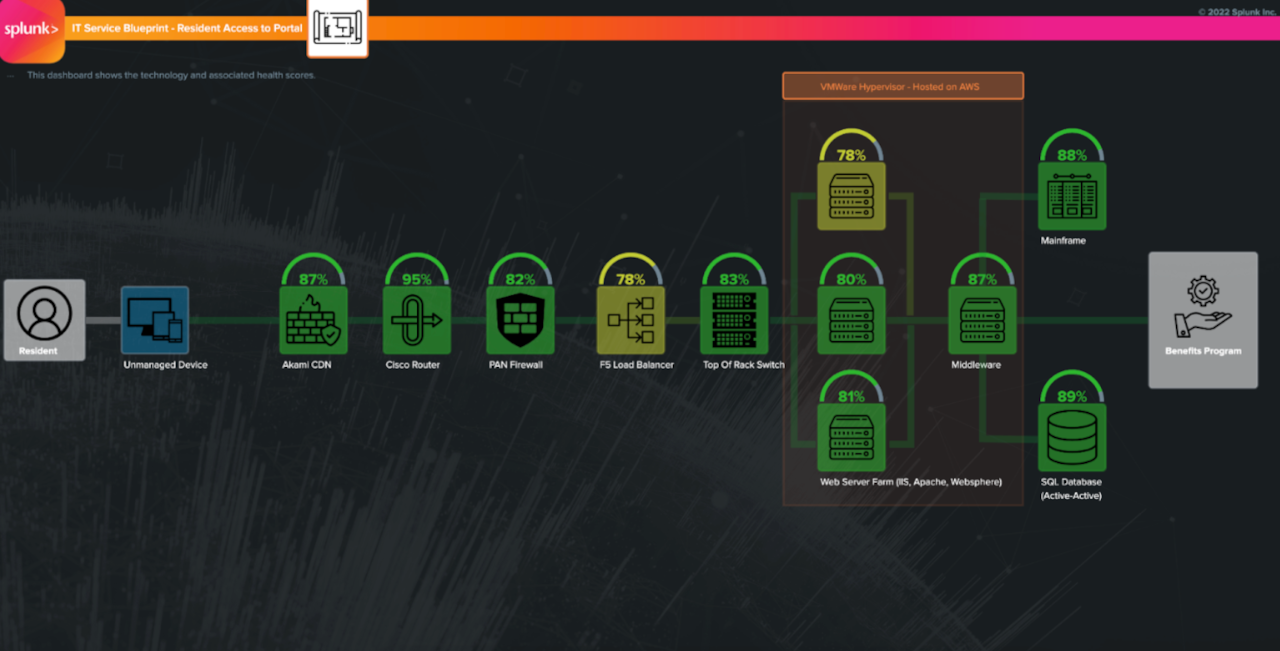
Understanding the IT Service Blueprint
An IT Service Blueprint is a visual representation of the various components and processes that make up an IT service. It typically includes information about the service's stakeholders, customer needs, the service's value proposition, and the various components (such as processes, technology, and people) that are required to deliver the service. The purpose of an IT Service Blueprint is to provide a clear and comprehensive overview of an IT service, which can help organizations understand how the service is delivered and identify areas for improvement. ODAM provides a framework for defining, planning, executing, and measuring data analytics initiatives, which can be used to create an IT Service Blueprint for an IT service that leverages data analytics to deliver value to stakeholders, end users, and customers.
The IT Service Blueprint is a crucial tool for IT professionals looking to understand and manage the various components and processes involved in delivering an IT service. By providing a clear and comprehensive overview of the service, the IT Service Blueprint helps to break down silos and reveal opportunities for improvement and optimization.
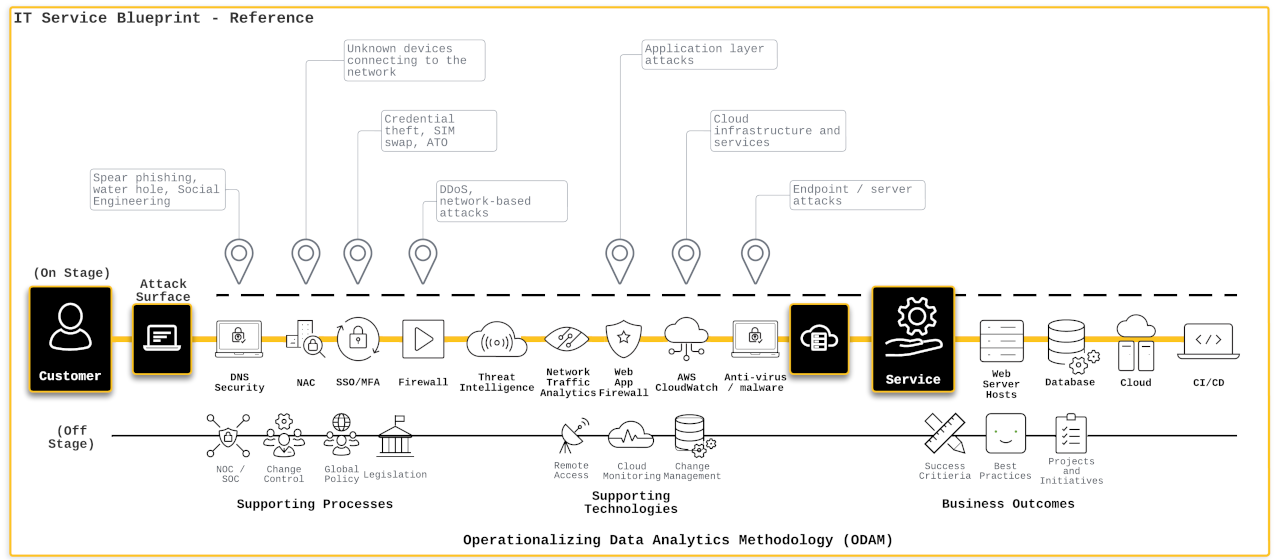
One of the key benefits of the IT Service Blueprint is its ability to provide a common "big picture" view of the service, which can be helpful in understanding the service in a holistic manner. This view takes into account the situational and contextual factors that may impact the service, and helps to provide a point of view that is focused on the approach to delivering the service.
In addition to considering the current state of the service, the IT Service Blueprint also looks at the future state, and can help to identify any potential gaps or areas for improvement. With the ability to monitor real-time actions and gather evidence across channels, the IT Service Blueprint can be a valuable tool for ensuring that the service meets the needs and expectations of customers and users.
#
An IT Service Blueprint typically includes a number of different elements
These are the specific components or elements that make up the IT service, such as hardware, software, processes, or people.
These are the relationships between different service components, and how they depend on one another to function properly.
These are the ways in which the service interacts with other systems, processes, or resources within the organization.
These are the ways in which the service is delivered to customers or users, such as through self-service portals, phone support, or on-site support.
These are the measures or metrics used to track and assess the performance of the service, such as availability, reliability, or customer satisfaction.
An alignment map that shows how individuals interact with a digital organization is a visual representation of the ways in which people interact with and engage with the various digital systems, processes, and resources that are available within the organization. The purpose of such an alignment map is to provide a clear and comprehensive overview of how people use and access digital resources, and to help identify any gaps or areas for improvement in the user experience. An alignment map might include a number of different elements.
User profiles
These are the different types of users or customer segments that interact with the digital organization, and may include categories such as employees, customers, partners, or stakeholders.
User journeys
These are the steps or actions that users take when interacting with the digital organization, such as visiting a website, filling out a form, or making a purchase.
User touchpoints
These are the specific points of interaction between users and the digital organization, such as a website, mobile app, or customer service hotline.
User feedback
This is the feedback and insights that users provide about their experience with the digital organization, including their needs, preferences, and areas for improvement.
An alignment map that shows how individuals interact with a digital organization can be a valuable tool for understanding the user experience and identifying areas for improvement. It can help to identify any gaps or problems in the user journey, and to develop strategies for improving the user experience and engagement with the digital organization.
An IT Service Blueprint is a visual representation of the systems, processes, and resources that are required to deliver a specific IT service. It helps IT professionals understand how the various components of the service fit together and interact, and ensures that the service meets the needs and expectations of customers and users.
#
Benefits to using an IT Service Blueprint
An IT Service Blueprint helps to break down silos by providing a common view of the service, and how the various components and processes fit together. This can help to improve collaboration and communication within the IT team, and can lead to more efficient and effective service delivery.
By providing a comprehensive view of the service, an IT Service Blueprint can help IT professionals identify opportunities for improvement, such as streamlining processes or optimizing resources.
An IT Service Blueprint helps to provide a common "big picture" view of the service, which can help to improve understanding and alignment among team members and stakeholders.
An IT Service Blueprint takes a holistic view of the service, and helps IT professionals understand how the various components and processes fit together as a whole.
An IT Service Blueprint provides a situational and contextual view of the service, and helps IT professionals understand how the service operates in different situations and contexts.
An IT Service Blueprint provides a point of view on the service, and helps IT professionals understand how the service is perceived by different stakeholders.
An IT Service Blueprint defines the scope of the service, and helps IT professionals understand what is and is not included in the service.
An IT Service Blueprint focuses on the approach to delivering the service, and helps IT professionals understand how to best deliver the service to meet the needs and expectations of customers and users.
An IT Service Blueprint considers both the current and future states of the service, and helps IT professionals plan for the future evolution of the service.
An IT Service Blueprint helps IT professionals monitor the service in real-time, and take timely action to address any issues or problems that may arise.
An IT Service Blueprint provides evidence (data) across channels, and helps IT professionals understand how the service is being used and perceived by different stakeholders.
Lastly, infusing your supportive presence into the data is crucial for achieving success with your data analytics efforts. By leveraging the principles of ODAM, you can build a strong Analytics Center of Excellence that is well-equipped to support your business goals and objectives. By infusing observability into each IT Service Blueprint, you can help to ensure that your data analytics initiatives are aligned with your organization's values and are driving meaningful impact.
"The greatest value of a picture is when it forces us to notice what we never expected to see."
— John W. Tukey, Mathematician