ODAM
Data Universe Explorer

See how risks, outcomes and signals connect.

A navigable map of what an organization commits to protect and measure, how evidence joins to those commitments, and where the judgment calls are. It isn't for sale. Ask, and we'll send it.

A shared reference map. It does not connect to your systems.

One self-contained HTML file. Best explored on a laptop or larger screen.

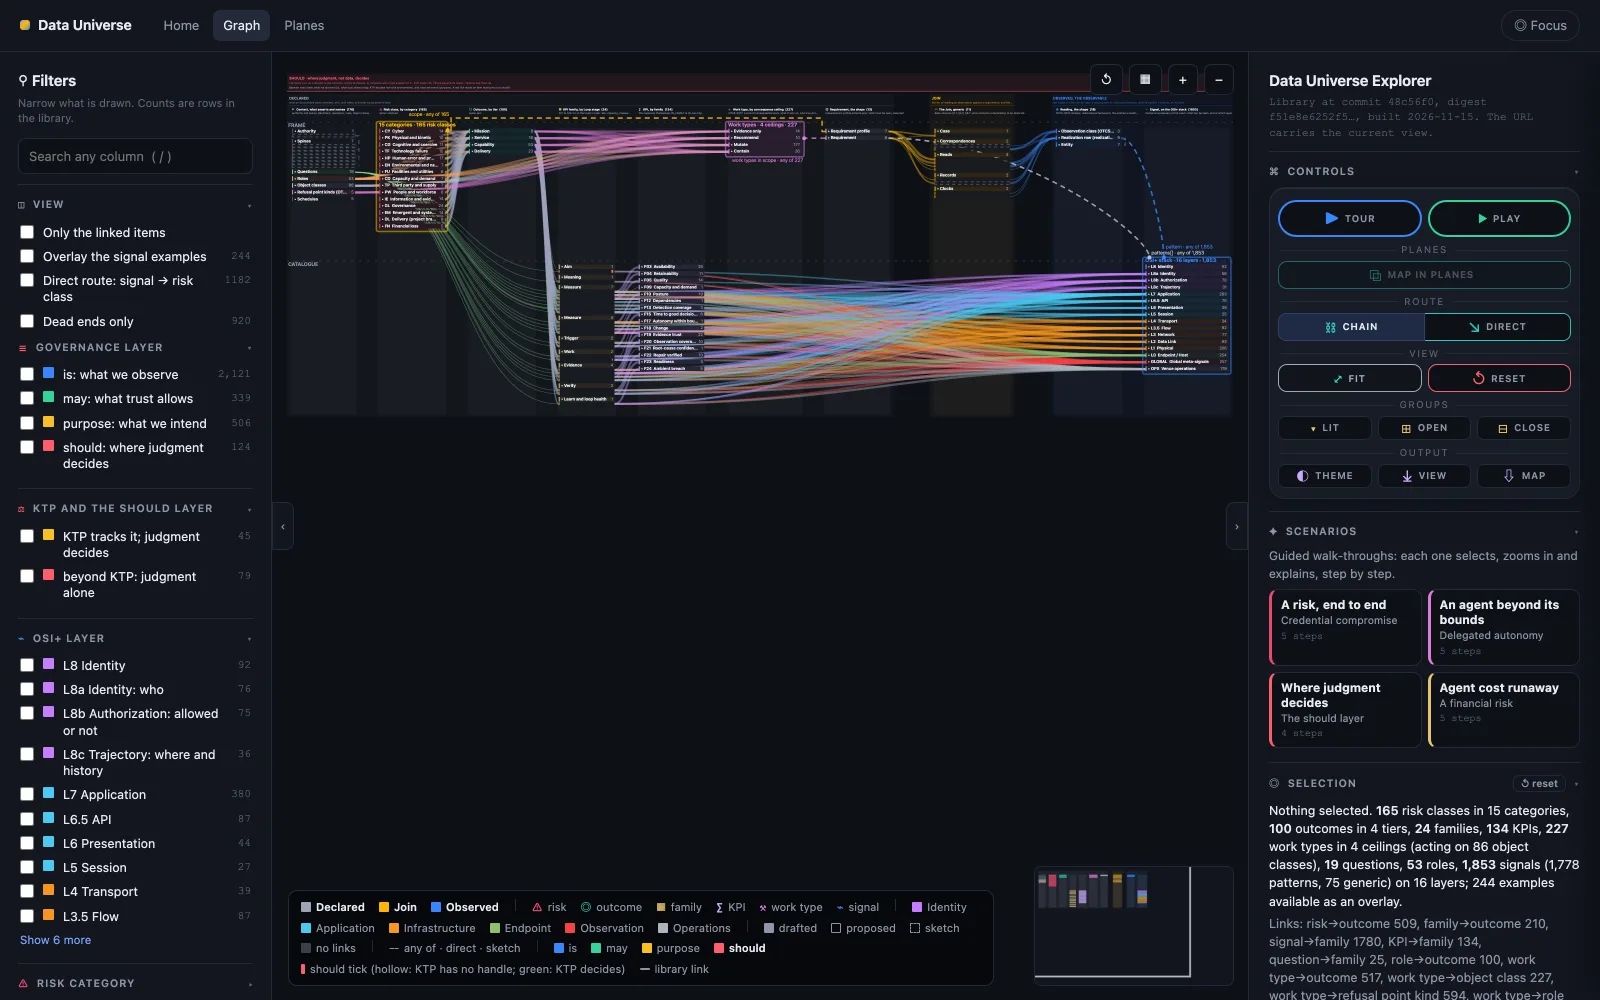
The Data Universe Explorer's full map in dark mode: declared risks and outcomes on the left, flows of color joining them to measures and signals by layer on the right, with filters and guided scenarios at the sides.
  • 165risk classes
  • 100outcomes
  • 134KPIs
  • 2,097signals
  • 4guided scenarios
Counts from the shared library as built on November 15, 2026.
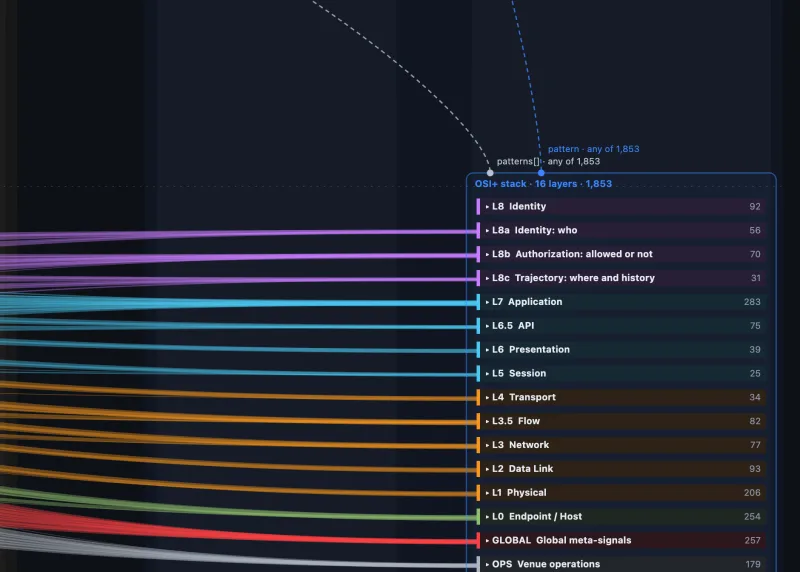
They're read from the Explorer build itself (library commit 48c56f0). The 2,097 signals include 244 worked examples; 1,853 are patterns and generic signals drawn on the map's 16 layers.
Signal to outcome, and back

Start from what you can see, or from what you must protect.

Fold nearly two thousand signals into their layers to see the main routes. Open them to see every one. Then follow a single thread in either direction.

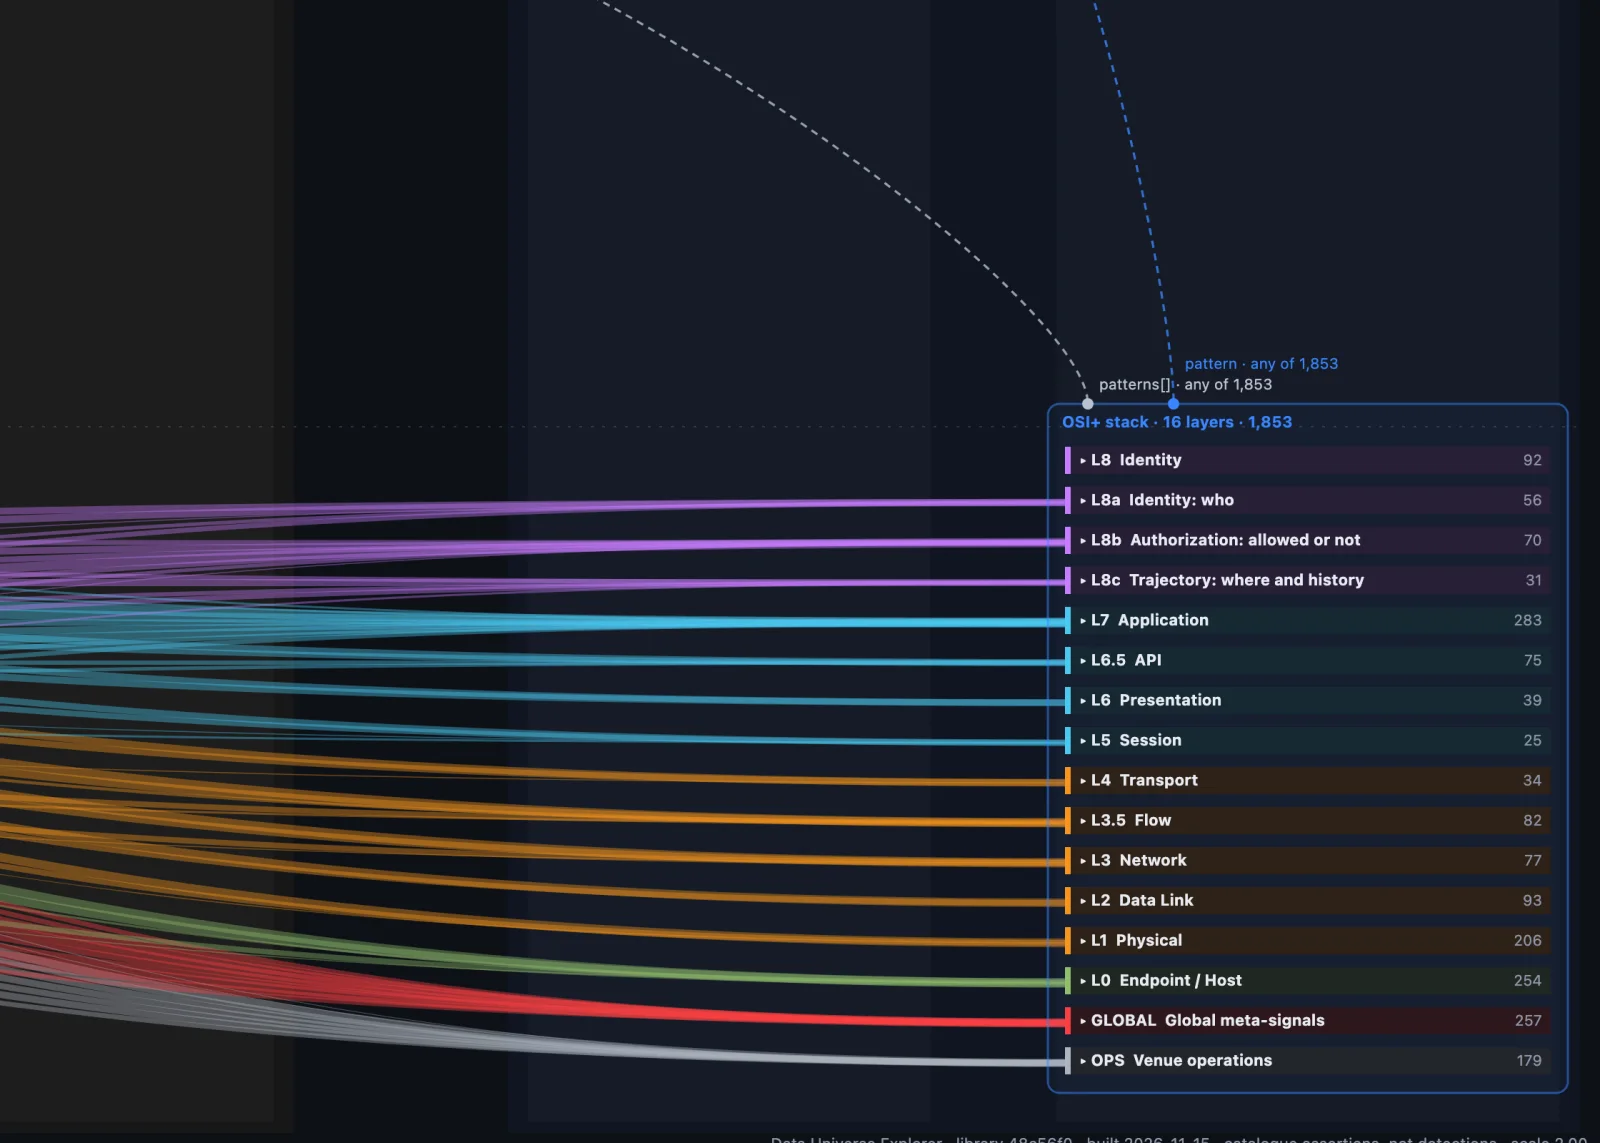
Collapsed: the Observed side of the Explorer, bottom right, with the signals folded into their sixteen layers, L8 Identity down through L0 Endpoint, Global and Venue operations, each fed by colored routes from the measures.
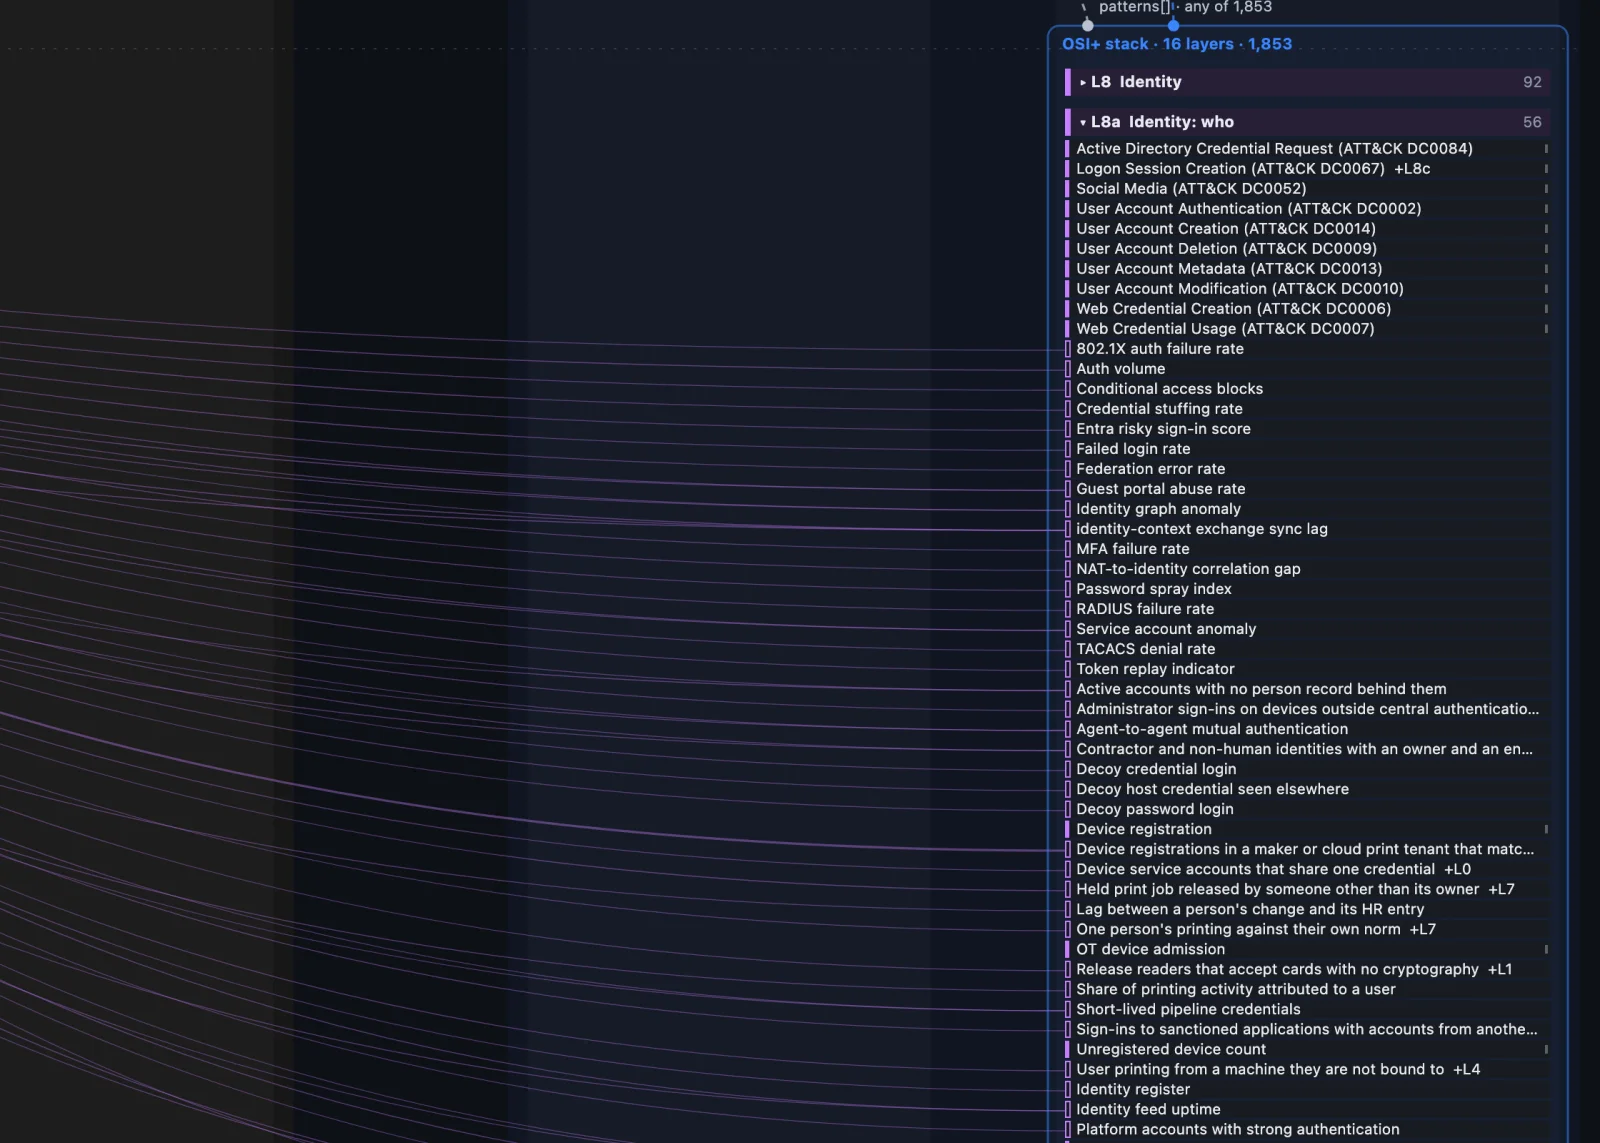
Expanded: the same corner with the L8a Identity: who layer opened, listing its individual signals, such as failed login rate, MFA failure rate and token replay indicator.

Collapsed groups reveal the main connections: 1,853 signals folded into 16 layers, L8 Identity down to L0 Endpoint, plus global and venue signals.

Signal outcomes

One signal, traced up.

In this library snapshot, the Token replay indicator links to one measure family. Follow that family to 6 outcomes and 31 risk classes you can investigate.
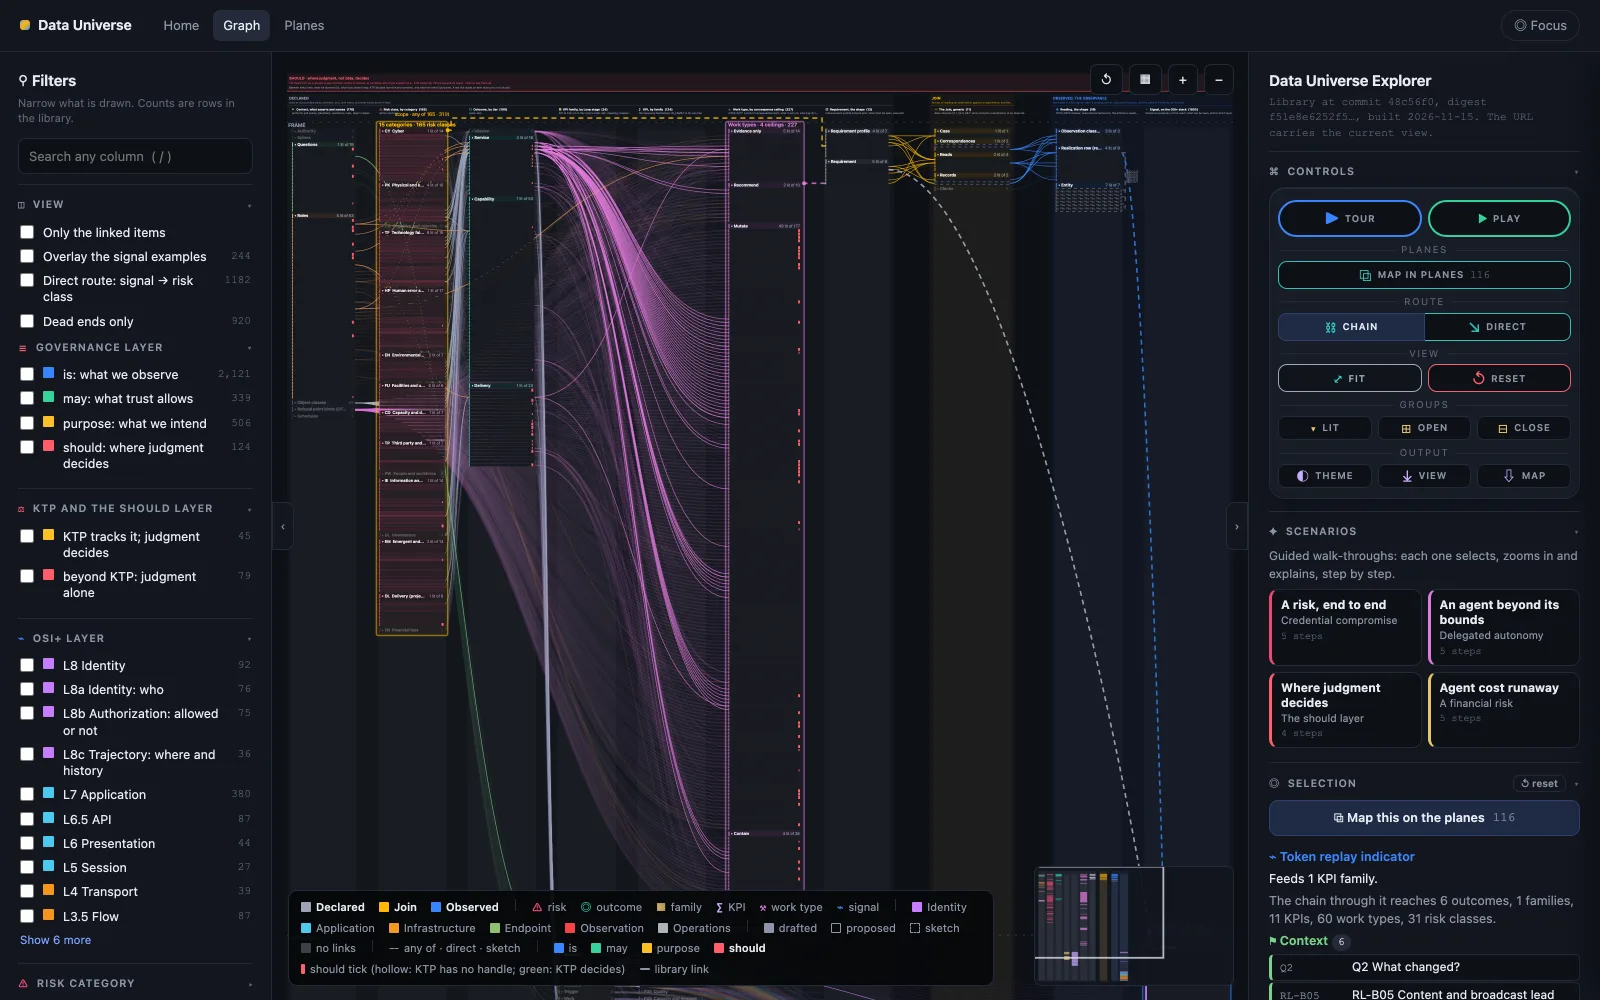
The Explorer with one signal selected, Token replay indicator: its routes light up through a measure family to six outcomes, and the panel lists the people and questions involved.
Outcome signals

One outcome, traced down.

The map links "Agent access follows live risk" to 2 KPI families, 6 KPIs and 98 candidate signals. Use those links to decide which readings to collect and test in your environment.
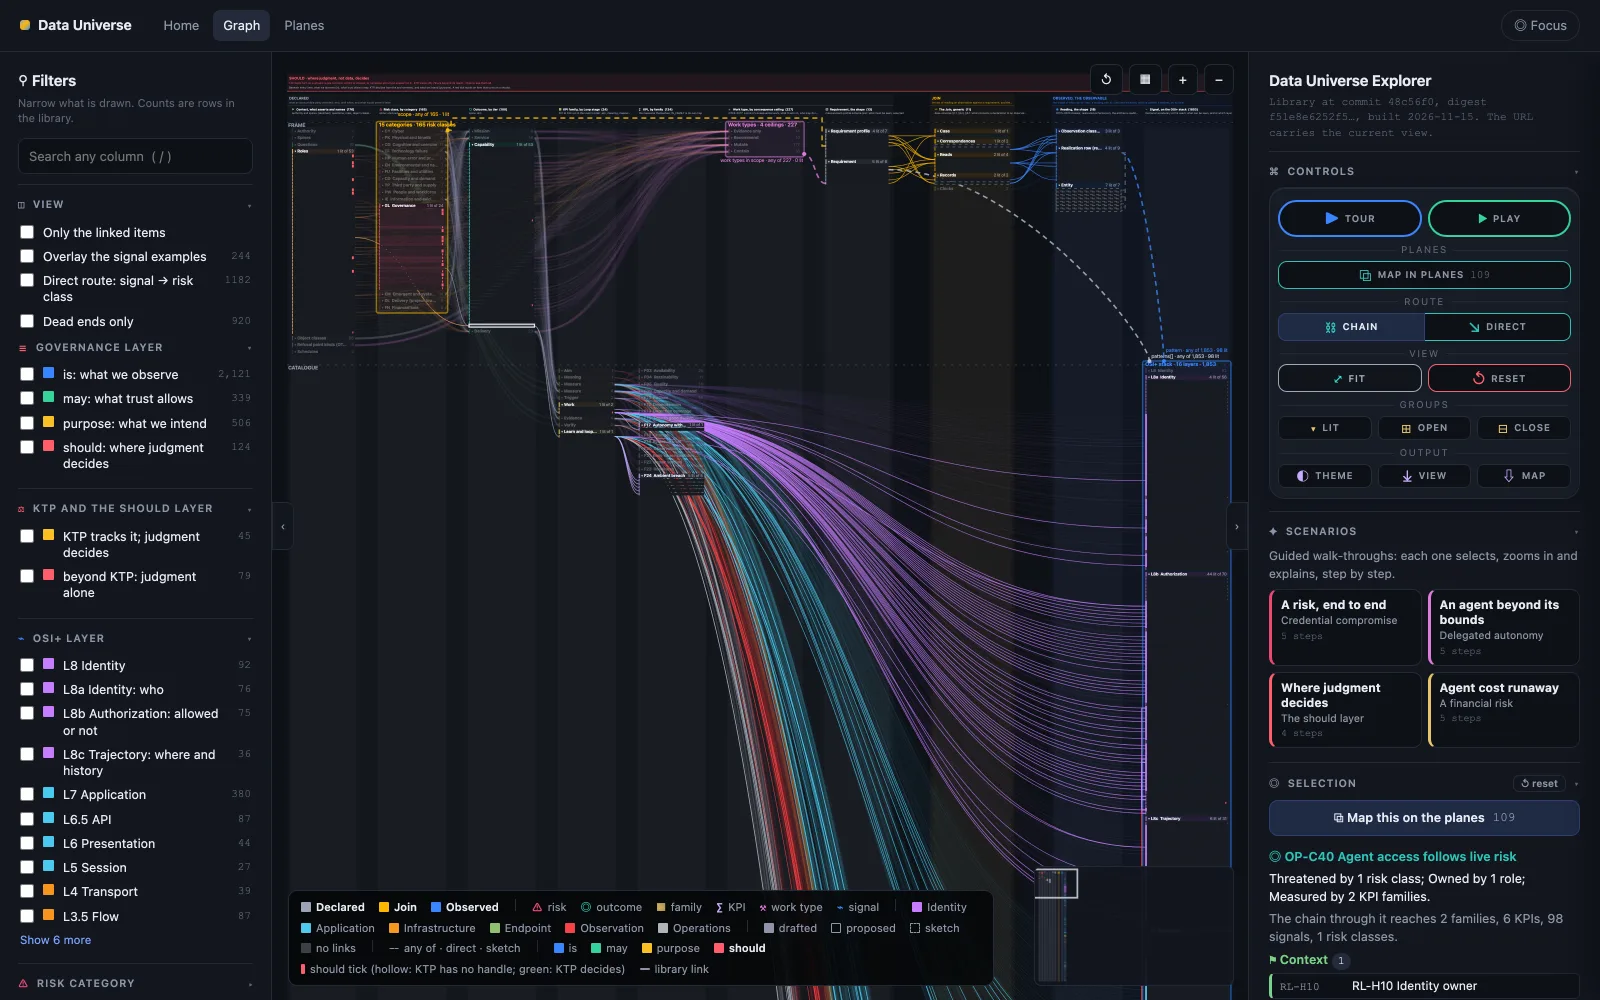
The Explorer with one outcome selected, Agent access follows live risk: routes fan out to its two KPI families and the 98 candidate signals linked in the library, with its owner role listed.

These counts describe links in the shared library. Verifying an outcome requires current evidence from your own systems.

What you can do with it

Answer the questions that land on your desk.

Trace

Follow one risk all the way down.

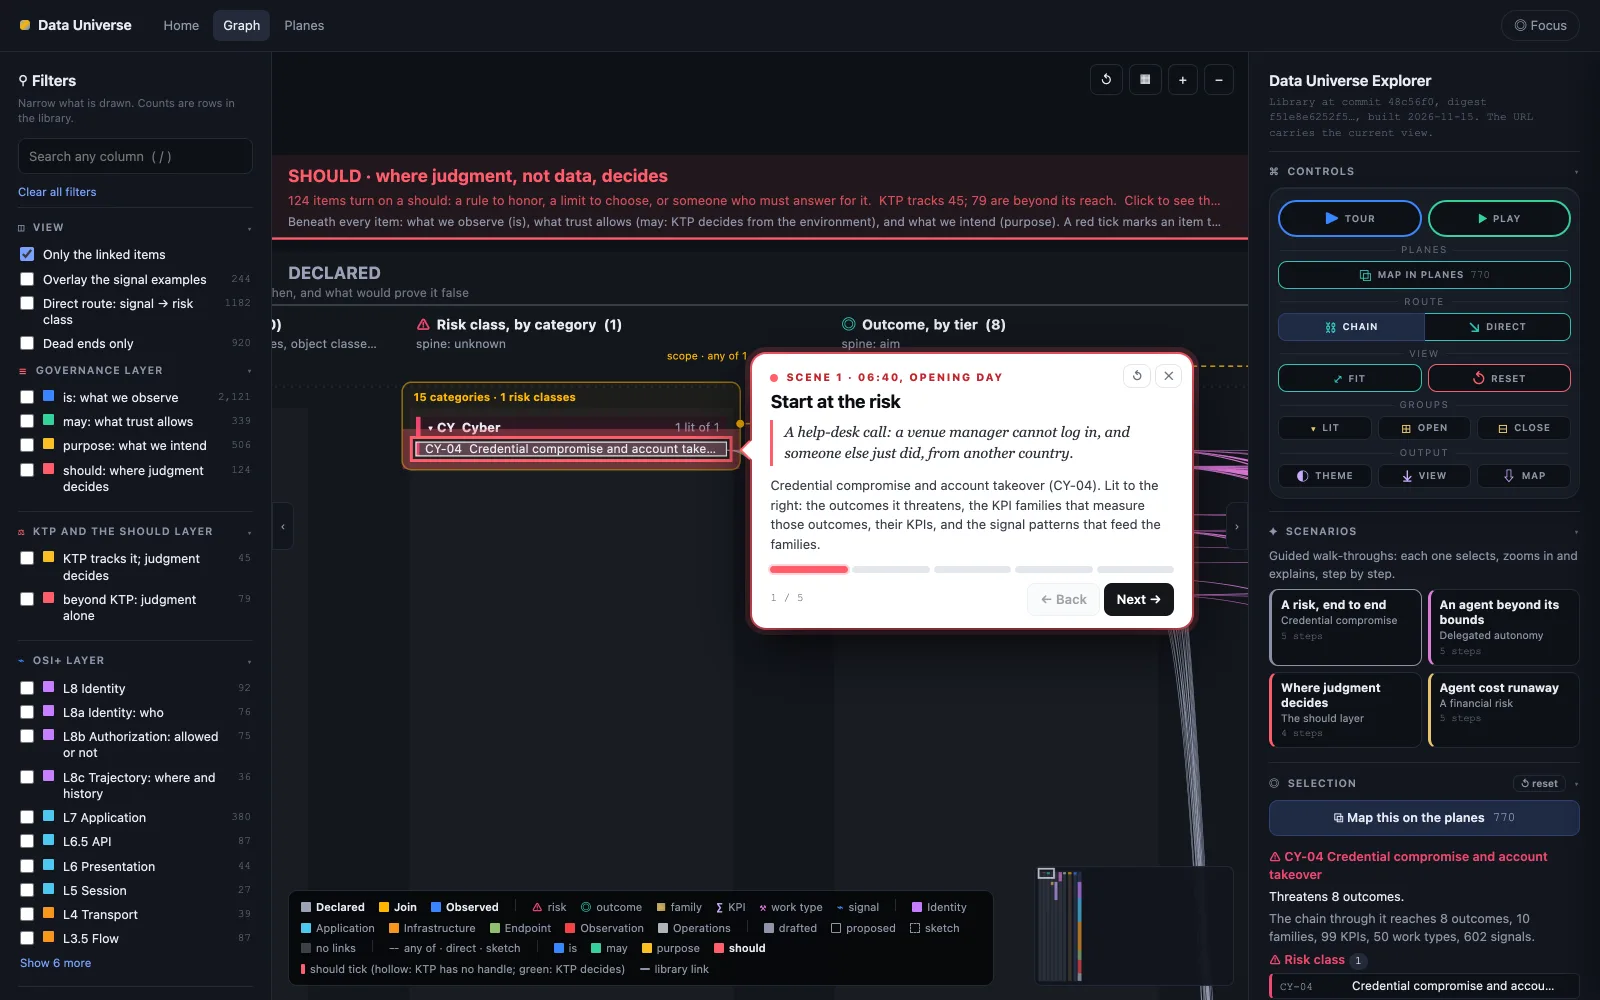
Pick a risk and the map lights everything it touches: the outcomes it threatens, the measures that watch them, and the signals that would show it happening.
  • Risk to outcome to measure to signal, in one view
  • Chain or direct routes
  • Counts at every step
The Explorer with the credential-compromise scenario open: the risk is highlighted and a scene card explains it.
Judgment

Make the judgment calls explicit.

The shared library flags 124 items that call for judgment. For 45, KTP can track or record part of the issue and people still decide. The other 79 lie outside the protocol's scope in this model.

Proposed classifications in this library snapshot; these are not performance results.
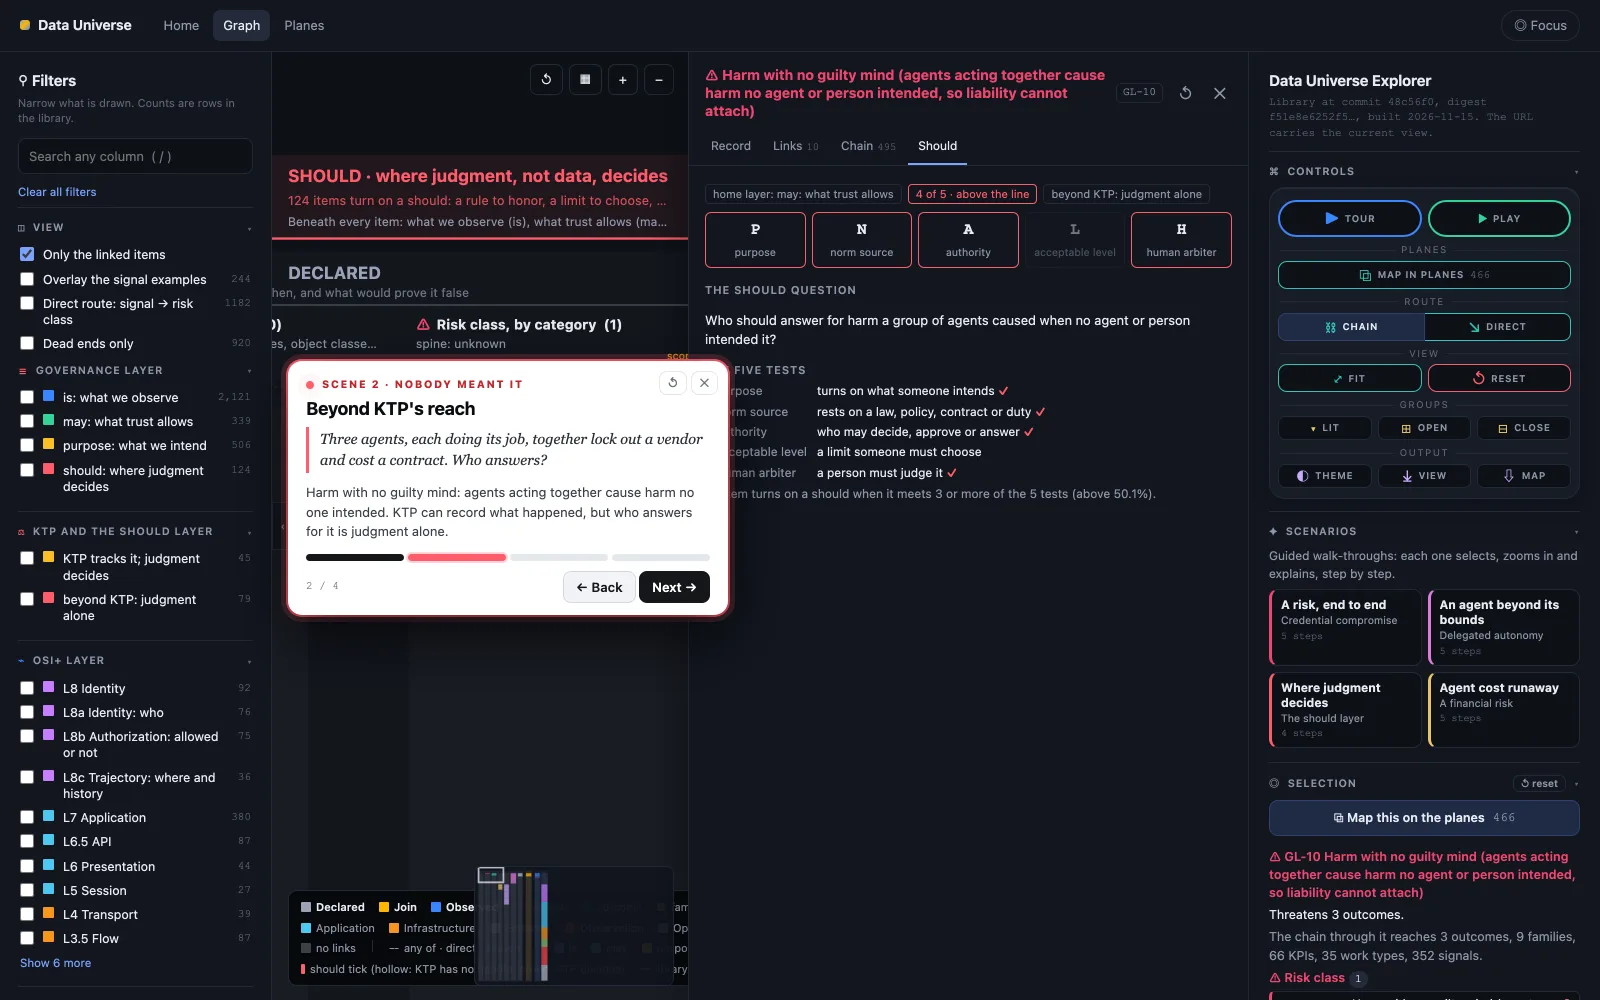
  • Five tests for every should
  • What KTP can track, and what's beyond it
  • Which items people must decide
The Explorer's should layer: a record of harm with no single responsible party, scored against five tests.
Agents

Trace where an agent exceeds its authority.

Walk through an agent that was allowed to act, but past the scope it was given. See which outcomes are exposed, which measures would notice, and who owns each one.
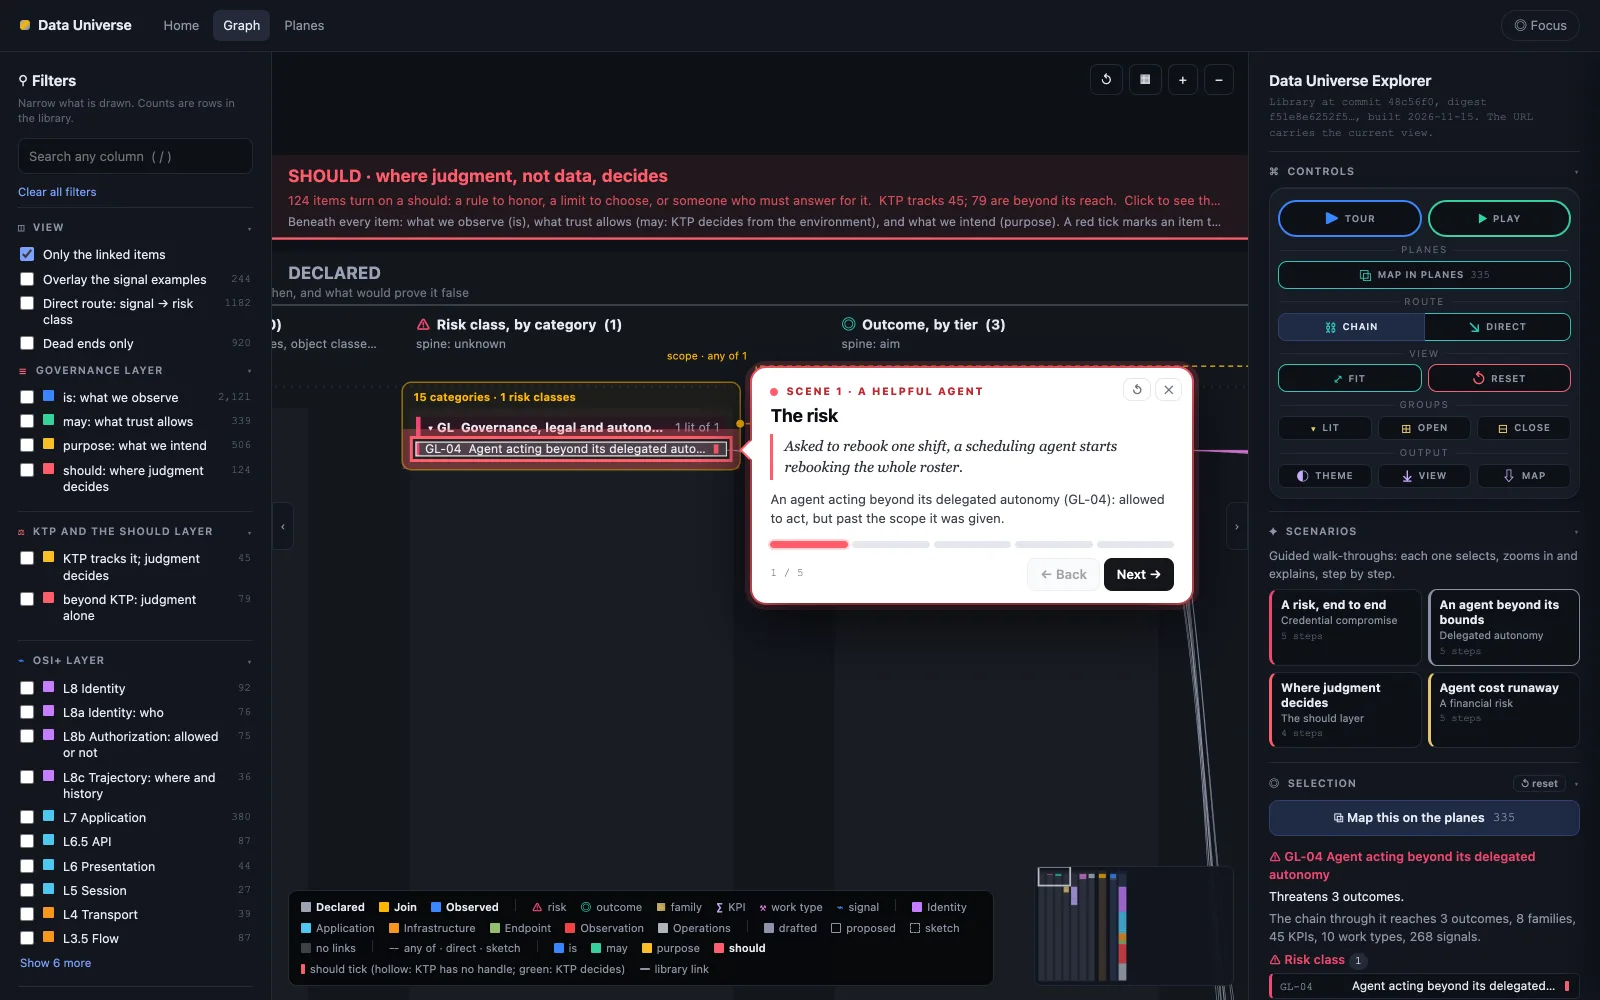
  • Delegated autonomy, end to end
  • The roles that own each outcome
  • The evidence a review would need
The Explorer tracing an AI agent acting beyond its delegated autonomy, with the linked outcomes and measures listed.
Scenarios

Walk the scenarios your board asks about.

Four guided walk-throughs open with a plain story and zoom in step by step: credential compromise, an agent beyond its bounds, the should layer, and agent cost runaway.
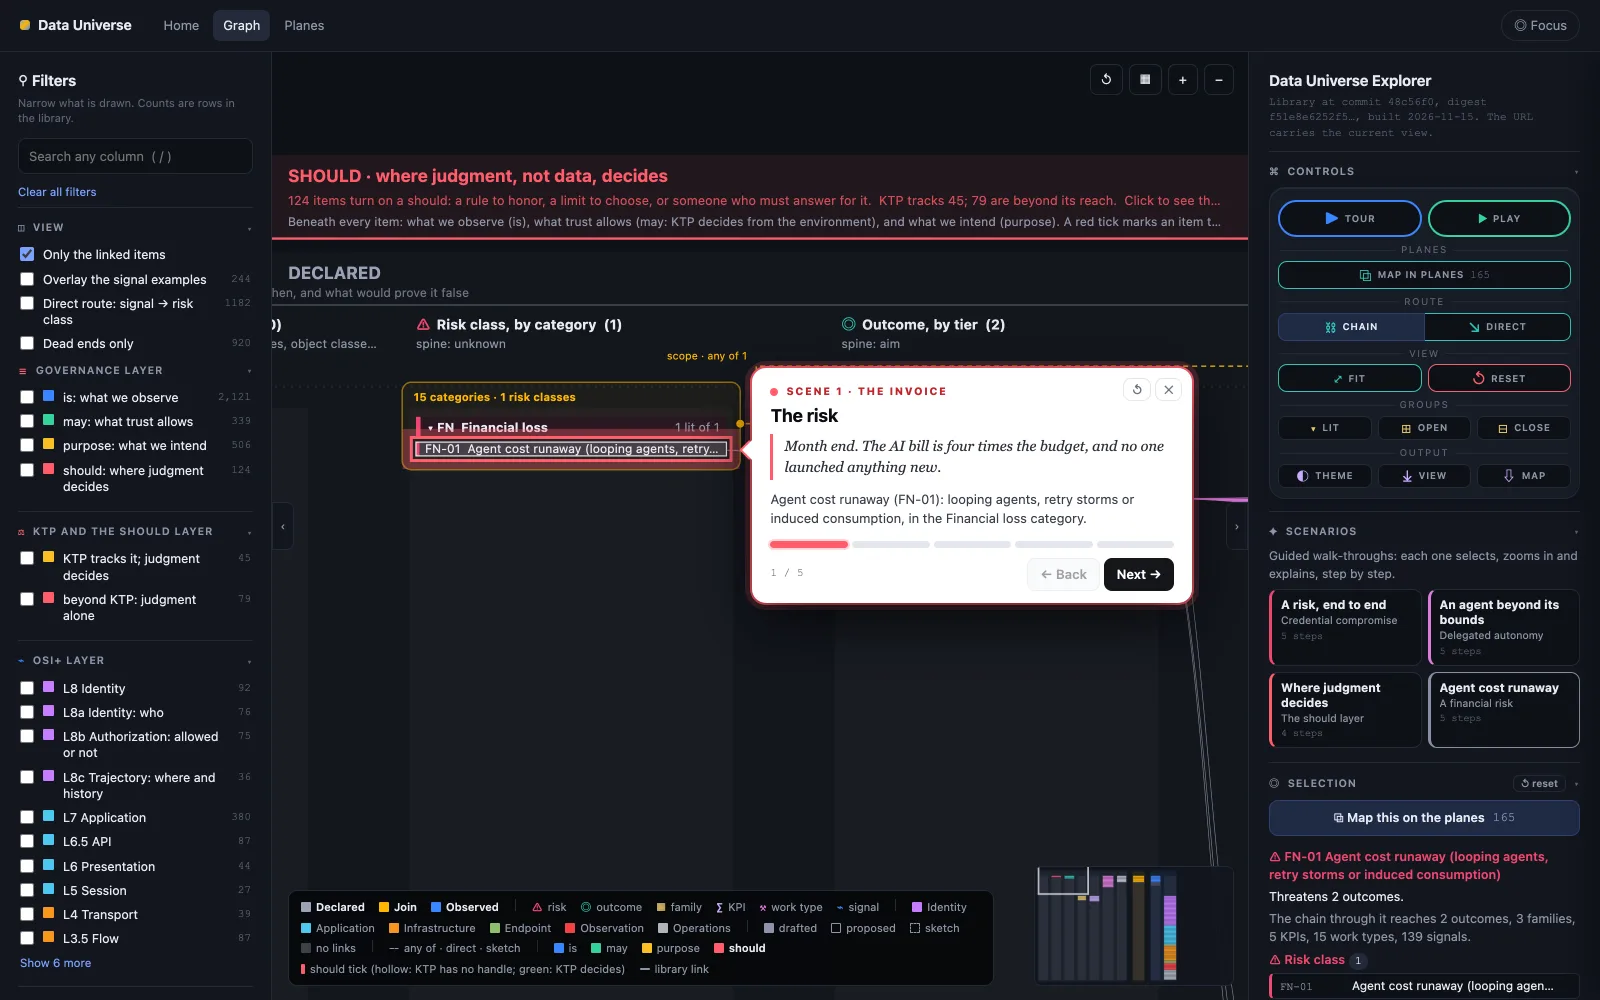
  • Story first, structure second
  • Five steps or fewer each
  • Built for a leadership read-out
The Explorer's agent-cost-runaway scenario: looping agents and retry storms traced to the financial-loss category.
The tour

Thirty-seven seconds, the whole map.

How it fits

The reference map behind ODAM's three connected graphs.

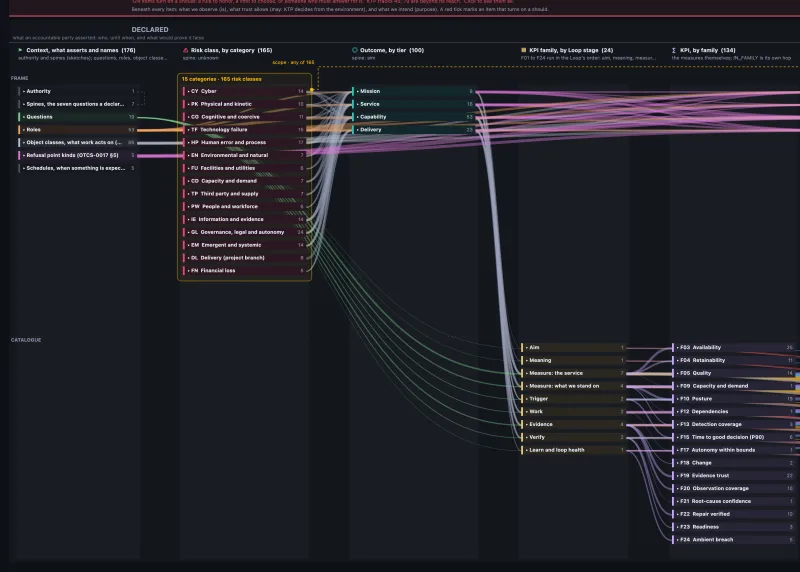
The Declared side of the Explorer: risk classes by category, outcomes and the measure families, with routes running between them.
DeclaredWhat we commit to protect and measureRisks, outcomes, measure families and KPIs
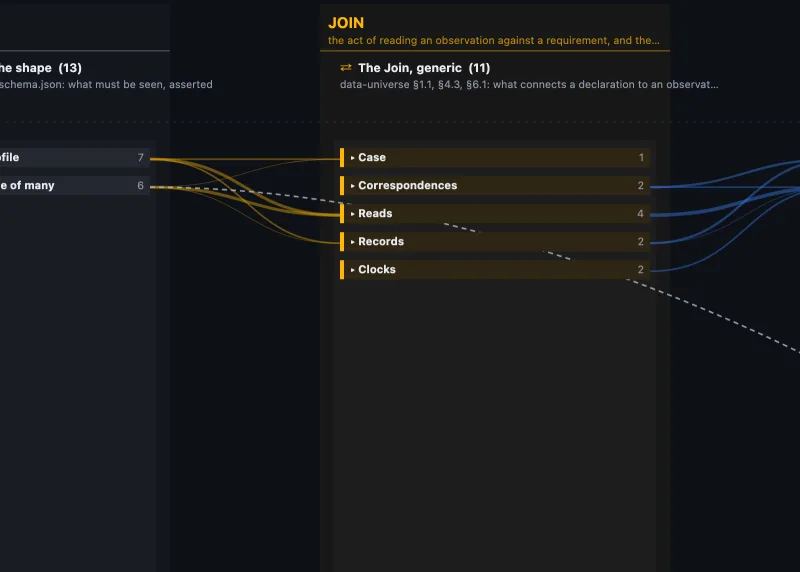
The Join band of the Explorer, in gold: five groups, case, correspondences, reads, records and clocks, with requirements flowing in from the left and observations from the right.
JoinHow evidence compares with a requirementCase, correspondences, reads, records and clocks
The Observed side of the Explorer: the signal layers from L8 Identity down to L0 Endpoint, Global meta-signals and Venue operations, each fed by colored routes.
ObservedWhat could show it happening1,853 signals across 16 layers, L8 to L0

It shows the shared library's structure, not your organization's live evidence. Nothing in it reads your systems.

Who it's for

Built for the people who answer for the outcome.

CIOs and CTOs

See where AI-era work needs an owner, a measure and a review, before it's in production.

CISOs

Plan which signals to watch and where evidence is still needed.

Platform and data leaders

Find candidate measures, roles and signals in the shared library, then assess them against your needs.

What you get

One file. Open it in any browser.

  • The full map of the shared library, as a single HTML file.
  • The four guided scenarios, filters and search.
  • Light and dark themes. The address bar records your selections and filters, so you can return to them.
  • Open it locally in a modern desktop browser. No installation, account or network connection required. It sends no usage data; your light/dark preference is saved in your browser.
Questions
Is it for sale?

No. There's no price and no license fee. Ask for it and you'll receive it. Requesting it by email shares the contact details you send.

Why ask, then?

So we know who's using it and can send the updated build when the library changes.

Does it read our data?

No. It holds the shared reference library only. It doesn't connect to anything, and nothing leaves your machine.

Is it an assessment of our organization?

No. It's reference material: a map of what to protect, measure and watch. Assessing an outcome is what the maturity profile is for.

Who maintains it?

Chris Perkins maintains it. New builds incorporate changes to the shared library.

Not for sale

Ask for the Explorer.

Send a short note with your name, role and what you'd like to use it for. You'll receive the HTML file by reply.